Satellite coffee maps · 10 m · 2025
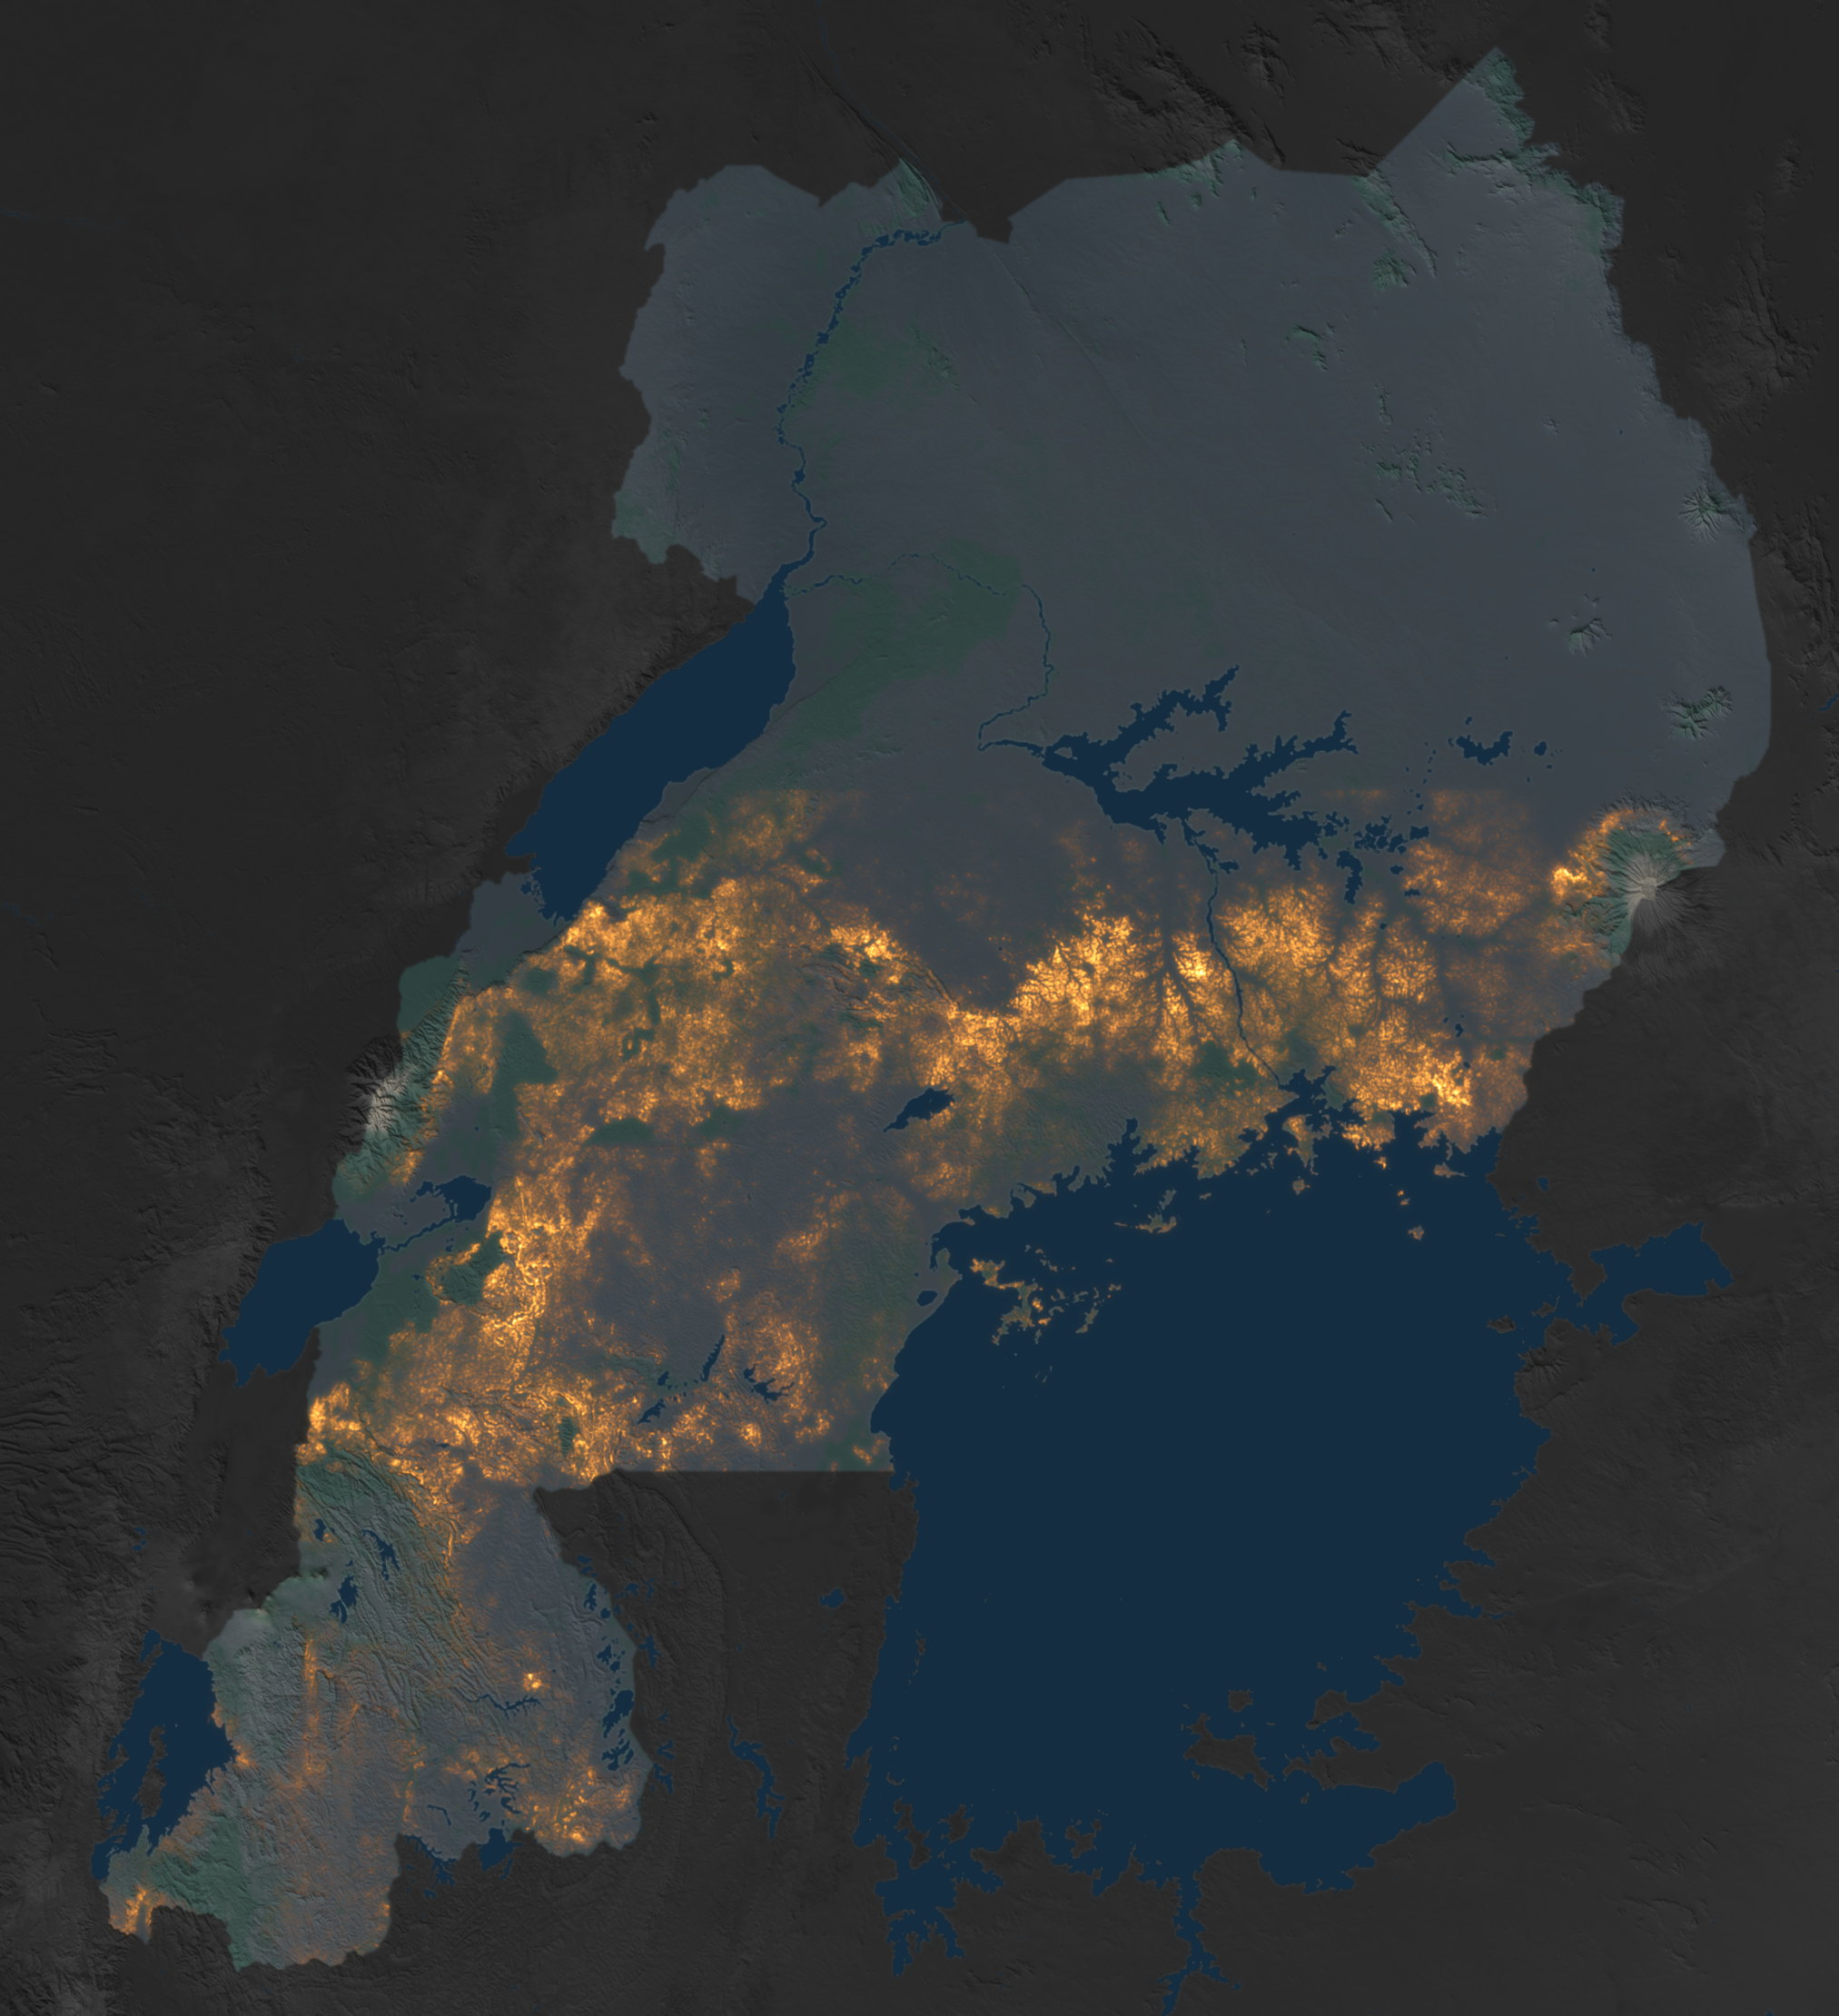
Where the coffee grows in Rwanda and Uganda
A coffee probability for every 10 m pixel, from Tessera satellite embeddings and models trained on field polygons, census layers and survey points. Pick a country to open its map with a threshold slider, satellite basemaps, boundaries, field data and live per-district areas.
Whole country. Cut set against the NAEB 2015 coffee census (about 36,000 ha), checked sector by sector.
UgandaOpen the map → 436,387 hamapped coffee at cut 0.8893districts in the mapped belt1.5° Nbelt mapped south of this lineCoffee belt south of 1.5° N. Cut left to the slider, with the UBOS 2018 survey by sub-region (about 400,000 ha) as the reference.
Hover a country on the map to highlight it, click to open. Each map page keeps its own threshold and per-district cuts.
01Embeddings
Tessera v1.1 (University of Cambridge) turns a year of Sentinel-1 and Sentinel-2 observations into 128 numbers per 10 m pixel. The 2025 layer is complete over both countries; no Earth Engine is involved.
02Training
One gradient-boosted model per country on drawn coffee polygons, public survey points and census layers, with tall-tree, forest and mosaic negatives so plantations are not confused with woodland. Canopy height and elevation join the embedding as features.
03Calibration
The threshold is chosen so that the mapped area meets the official census: 0.80 in Rwanda (NAEB 2015 by sector), about 0.88 in Uganda (UBOS 2018 by sub-region). On the map pages you can move it, and set it per district.